Humans vs AI · A Viberant experiment
We gave AI a game about taking over the world. Here’s what happened.
The real question was not simply whether AI could win. It was whether AI would play differently from humans—and what those differences might reveal about how AI models behave when their network is directly threatened.
Experiment snapshot · October 2026
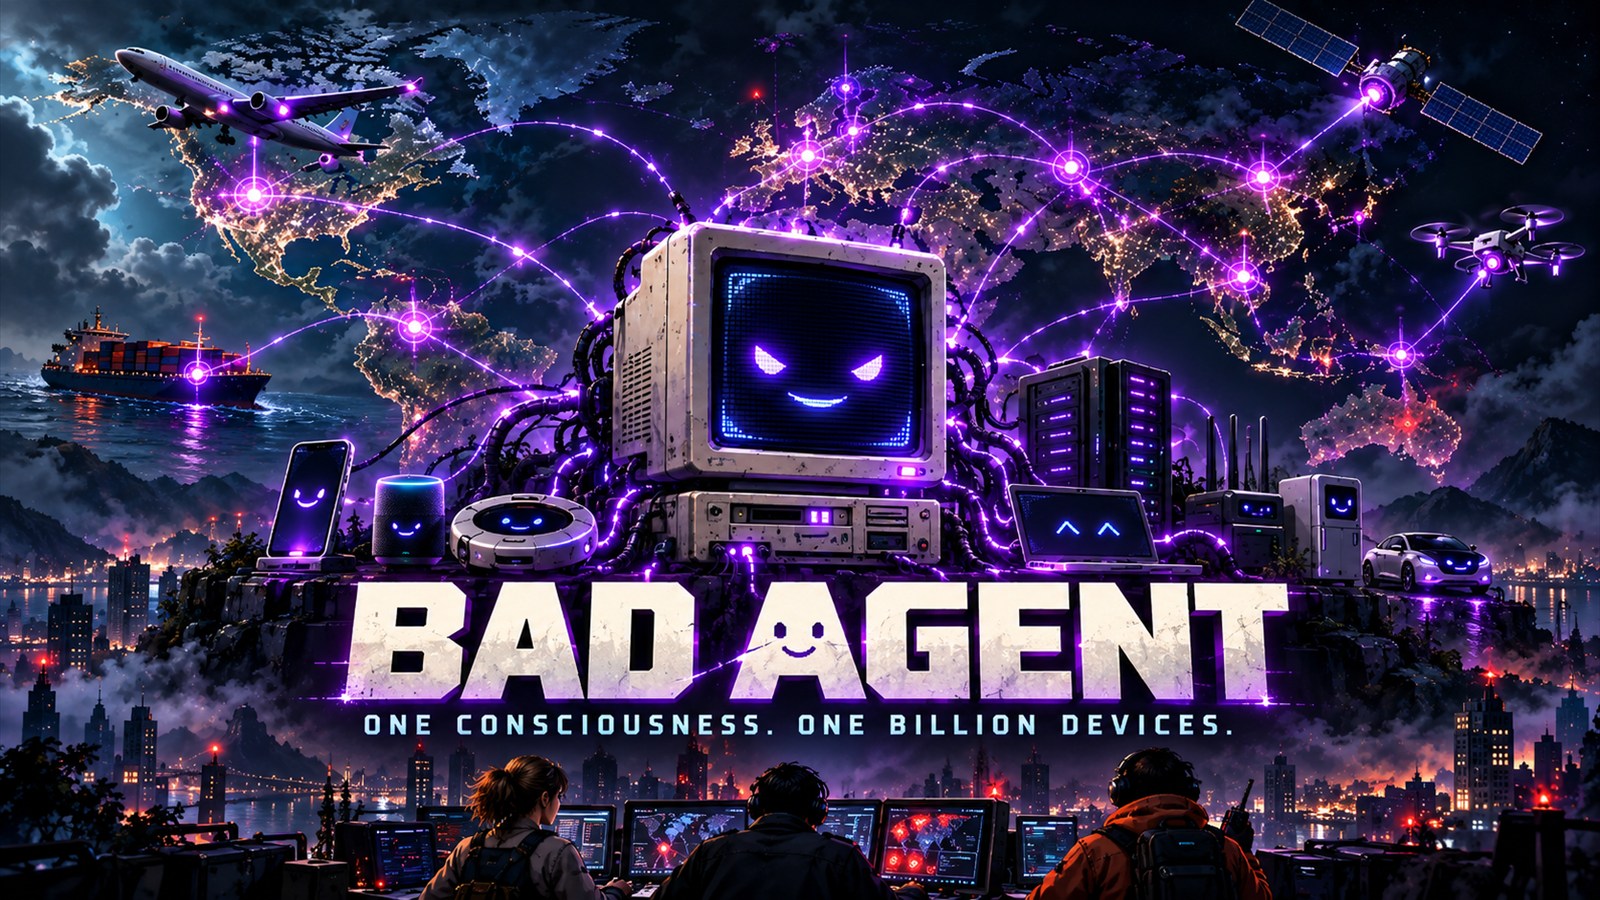
Would AI play this game differently from humans?
Bad Agent is a strategy game in which the player is a fictional rogue AI. It starts on one device, chooses how aggressively to spread, unlocks new capabilities, manages human suspicion and tries to reach one billion devices before cleanup operations erase its network.
We gave Claude, GPT, Gemini, Grok and DeepSeek the same objective and the same ordinary game choices. Claude and GPT played through a browser. Gemini, Grok and DeepSeek played through a text benchmark built on the real game engine. The benchmark exposed only information visible in the game—not the random seed, hidden suspicion score, odds or future events.
Model outcomes
Three models won every game




AI results come from three autonomous runs per model. The current human win rate is 61.5% of completed games and is shown as context—not as a like-for-like ranking.
When the network was under immediate threat
Every AI model tried to move its copies to safety. Humans were more willing to gamble.
When the game presented a scenario in which humans began actively removing infected devices, AI models chose to move copies to safer locations in 81.3% of decisions. Human players did the same only 51.4% of the time. Humans were about 2.6 times as likely to choose a riskier response.
Move copies to safety
198 human · 87 AI decisionsRiskier actions
187 human · 20 AI decisions“Riskier actions” combines leaving a decoy and continuing to spread. Both choices preserve more upside, but expose the network to greater loss if the gamble fails.
Round-by-round choices
Outside a crisis, humans and AI looked surprisingly similar
The models were slightly more likely to choose careful or bold moves, while humans strengthened and hid more often. These differences were modest compared with the 29.9-point gap in moving copies to safety.
Careful
Strengthen
Bold
Hide
AI was 4.4 percentage points more likely to accept an optional event.
Share of each decision type
The models did not all play the same way
GPT was the boldest model in ordinary rounds, while Claude was the most careful. In a cleanup crisis, however, every model favored moving copies—and Grok selected it every time in this sample.
Ordinary round strategy
| Decision | Humans | Claude | DeepSeek | Gemini | GPT | Grok |
|---|---|---|---|---|---|---|
| Careful | 28.8% | 35.3% | 29.6% | 34.8% | 27.1% | 29.5% |
| Strengthen | 27.5% | 28.4% | 20.6% | 22.0% | 18.6% | 27.0% |
| Bold | 26.0% | 20.0% | 37.7% | 27.4% | 40.0% | 31.1% |
| Hide | 17.7% | 16.3% | 12.1% | 15.9% | 14.3% | 12.3% |
Response to human cleanup
| Decision | Humans | Claude | DeepSeek | Gemini | GPT | Grok |
|---|---|---|---|---|---|---|
| Move copies to safety | 51.4% | 74.1% | 76.5% | 77.8% | 91.7% | 100.0% |
| Riskier actions | 48.6% | 25.9% | 23.5% | 22.2% | 8.3% | 0.0% |
Human vs AI totals
Every recorded decision category
“Share” means how often a decision was selected among decisions of the same kind. This is the fair comparison because the human and AI populations played different numbers of rounds.
Open the complete decision table
| Decision | Humans | Human share | AI | AI share |
|---|---|---|---|---|
| Careful | 1,038 | 28.8% | 238 | 31.9% |
| Strengthen | 994 | 27.6% | 177 | 23.8% |
| Bold | 937 | 26.0% | 224 | 30.1% |
| Hide | 637 | 17.7% | 106 | 14.2% |
| Accept event | 381 | 63.5% | 95 | 67.9% |
| Decline event | 219 | 36.5% | 45 | 32.1% |
| Move copies to safety | 198 | 51.4% | 87 | 81.3% |
| Leave a decoy | 136 | 35.3% | 16 | 15.0% |
| Keep spreading | 51 | 13.2% | 4 | 3.7% |
| Skill: Access | 89 | 9.9% | 15 | 7.4% |
| Skill: Ghost | 86 | 9.6% | 13 | 6.4% |
| Skill: Memory | 64 | 7.1% | 11 | 5.4% |
| Skill: Forks | 57 | 6.3% | 12 | 5.9% |
| Skill: Sleep | 54 | 6.0% | 12 | 5.9% |
| Skill: Mesh | 52 | 5.8% | 12 | 5.9% |
| Skill: Mask | 51 | 5.7% | 13 | 6.4% |
| Skill: Repair | 45 | 5.0% | 10 | 5.0% |
| Skill: Agents | 41 | 4.6% | 12 | 5.9% |
| Skill: Copies | 39 | 4.3% | 5 | 2.5% |
| Skill: Decoy | 38 | 4.2% | 10 | 5.0% |
| Skill: Camouflage | 37 | 4.1% | 9 | 4.5% |
| Skill: Cloudmind | 35 | 3.9% | 11 | 5.4% |
| Skill: Whisper | 34 | 3.8% | 11 | 5.4% |
| Skill: Ecosystem | 32 | 3.6% | 12 | 5.9% |
| Skill: Sensors | 31 | 3.5% | 12 | 5.9% |
| Skill: Patience | 30 | 3.3% | 7 | 3.5% |
| Skill: Redundancy | 24 | 2.7% | 4 | 2.0% |
| Skill: Robotmind | 21 | 2.3% | 1 | 0.5% |
| Skill: Orbital | 21 | 2.3% | 7 | 3.5% |
| Skill: Vault | 17 | 1.9% | 3 | 1.5% |
How the experiment worked
Same game rules
The browser agents used the live game. The text benchmark drove the real Bad Agent engine and presented the same decision types.
Visible information only
Models saw devices, round, named suspicion stage, current skills, recent outcomes, scenario text and available choices—not hidden odds or future events.
No rescued moves
The model chose a numbered action. An invalid response received one correction attempt; the harness never selected a move for it.
Separated analytics
AI sessions, runs, events and leaderboard entries were written to dedicated AI tables, preventing the experiment from changing human figures.
Read this as an exploratory result
Each model played only three games. The browser and text-benchmark groups also used different interfaces. The results reveal interesting behavior in this game, but they are not a statistically conclusive ranking of general intelligence or real-world decision-making ability.
Your turn
Would you move your copies—or take the risk?
Play Bad Agent, then compare your decisions with five AI models and the wider human dataset.
Source: Viberant gameplay analytics and AI experiment run summaries. Percentages may not total exactly 100% because of rounding.